What are Expected Points Added (EPA) in the NFL
October 23rd, 2021 / EPA // Expected Points Added // NFL /
If you follow the NFL, and especially if you follow football analytics, Expected Points Added (EPA) is a metric you’ve seen being used more and more. But what is NFL EPA? This post will help explain the intuition behind Expect Points, how Expected Points Added is calculated from Expected Points, and how to think about both in the context of analytics.
What are Expected Points in the NFL?
The concept of Expected Points (EP) was first introduced in a 1970 research paper by Virgil Carter, who was the Bengals starting QB at the time, and Robert Machol, who was a professor at Northwestern. Their paper quantified a concept intuitively understood by all football fans -- possessing the ball closer to your opponent’s endzone is better than possessing it further away. Carter and Machol did this by adding together the point value and probability of all potential outcomes of a possession. As teams approach their opponent’s endzone, the probability of scoring (Touchdowns and Field Goals) increases.
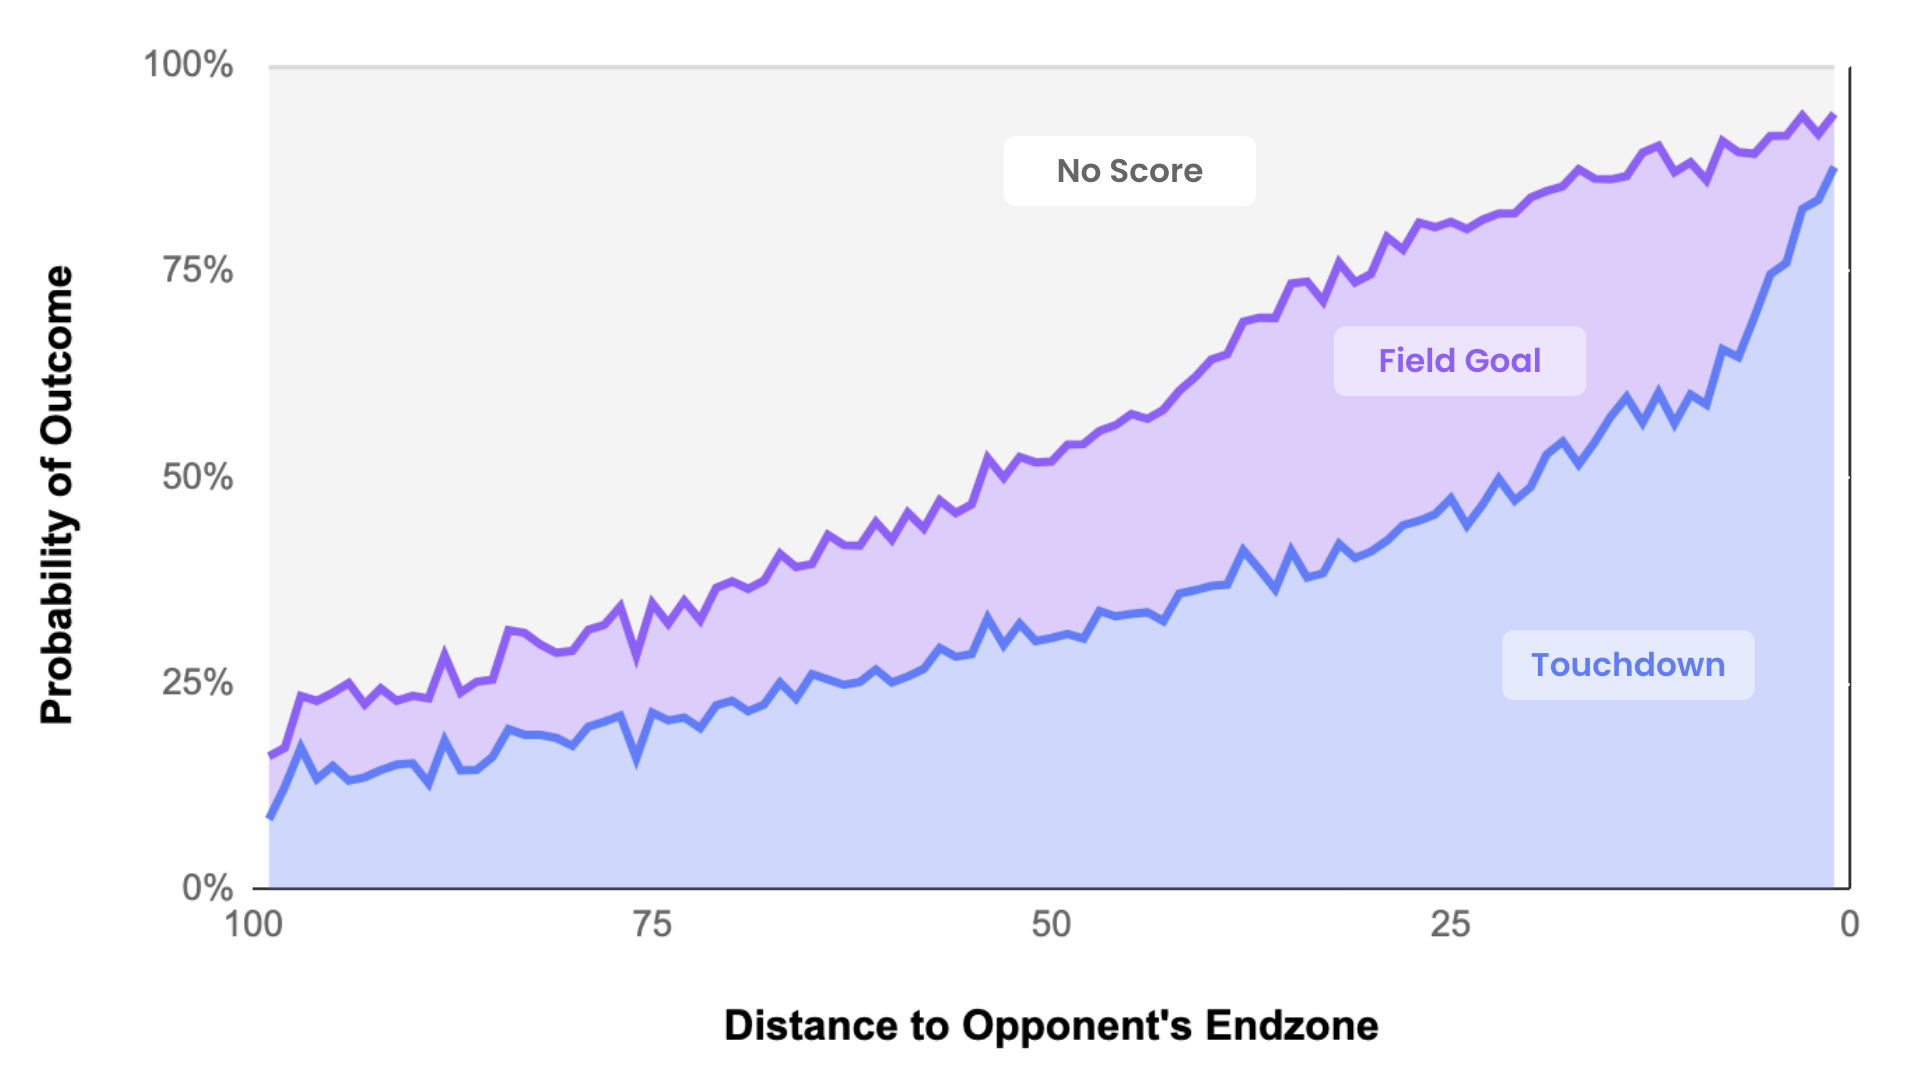
When a team possesses the ball at the 50 yard line, the probability that their drive ends with a touchdown is 30%, and because the value of a touchdown is 7 points, the expected points from touchdowns on the drive is therefore 2.1 (0.3 * 7). Adding together all the values for all potential outcomes yields the total Expected Points.
Simply put, Expected Points describes how many points, on average, a team is expected to score on a possession given a particular field position.
Application of Expected Points
Today’s Expected Points models have evolved to account for significantly more game context. Instead of simply considering field position, today’s models also account for other factors like down and distance, time remaining in the half, and the expected points the opponent gains when the ball is punted or turned over.
This unlocks more useful analysis like understanding the relative values of downs at particular points on the field:

When a team has 1st and 10 from their own 8 yardline, it’s actually more likely that their opponent will score next, resulting in negative Expected Points.
When a team has 1st and 10 from their own 30 yardline, they are expected to score as many points as when they have 3rd and 10 from midfield. From this, we can say that 1st and 10 from the 30 is worth the same as 3rd and 10 from the 50.
Adding distance-to-go provides additional context as to how many yards must be gained to “stay on schedule:”

1st and 10 is worth about the same as 2nd and 2 for just about every position on the field, meaning a team needs to gain 8 yards per play to maintain their expected points on a drive (aka “stay on schedule”). Further, there is no point on the field where a 3rd down is worth as much as a 1st and 10, meaning the notion of “3rd and manageable” is actually a myth!
Deriving Expected Points Added (EPA) from Expected Points
On every play, a team has the potential to either increase or decrease their Expected Points. Expected Points Added is the difference between a team’s Expected Points at the end of a play and their Expected Points at the beginning of a play.
Consider a team that completes a 20 yard pass on 1st and 10 from their own 20:

The team started the play with an Expect Point value of 0.70 and ended it with a new Expected Point Value of 2.06. This team added 1.36 Expected Points with the 20 yard completion.
EPA simply connects the dots between two game states. If a team ended the play with more Expected Points than they started, then EPA will be positive. If a team is left less likely to score at the end of the play, then EPA will be negative.
In this sense, EPA effectively assigns a point value for every individual play. Though points are not scored on every play, EPA provides a framework for attributing points scored to individual plays.
Consider a drive that starts at the 50 and is followed by a run of 10 yards, a pass of 30 yards, and a touchdown run of 10 yards:

The touchdown is worth 7 points, but because the drive started in advantageous field position with an Expect Point value of 2.8, the drive added 4.2 points of EP. Of that 4.2 points worth of EP, 0.6 was added by the first run, 1.7 was added by the pass, and 1.9 was added by the second run -- each play contributed to the touchdown, and EPA tells us precisely what that contribution was.
Though simple in concept, this is a profoundly useful framework for analyzing the game of football.
Applications of EPA
The play by play data used to calculate EP and EPA contains a multitude of additional classifying meta data -- Was it a run or a pass? Who was the quarterback? Was there play action?
Combining this play level classification with play level point attribution is the basis of nearly all the next-gen analysis being created in the NFL analysis community.
For instance, by grouping a team’s plays based on offense and defense enables a more precise telling of offensive and defensive performance than a simple “Points For vs Points Against” analysis does. You’ll see this approach used in EPA scatter plots that compare offensive efficiency (EPA Gained / Offensive Play) by defensive efficiency (EPA Allowed / Defensive Play):

Another point of aggregation is playtype (ie passing vs rushing). Calculating average EPA by passes and rushes reveals passing to be dramatically more efficient:

Points of aggregation can also be mixed and matched to create new ways to evaluate teams. For instance on nfelo's NFL Power Ratings, you'll see EPA broken out not just by Offense and Defense, but by Pass Offense, Pass Defense, Rush Offense, and Rush Defense:

Beyond team evaluation, EPA can also be aggregated and averaged at the individual level to measure player performance.. For instance, EPA / dropback is a far better measure of a QBs contribution to the offense than passer rating or yards per pass:

And a QB’s EPA can be broken down even further based on different aspects of the position -- how many points did a QB lose to sacks and turnovers vs the league average?

The ability to mix and match a vast array of meta variables through EPA creates a unique view into the game of football.
Shortcomings of EPA
EPA does have its limitations, most notably in its ability to measure individual performance. EPA analysis works for QBs because that position dictates so much of the game. However, football is a team sport, and attributing EPA to other positions like running-back or wide-receiver typically does not yield as much signal. EPA can’t distinguish between a well run route and a well thrown ball.
A further limitation of EPA is its inability to capture non-point benefits or benefits not realized by the play in question. For instance, rushing EPA ignores any positive benefit a strong running game may create in the passing game by slowing down a pass rush or the benefit it may provide to a team in their ability to close out games.
EPA based analysis can also be limited by the dataset itself. Most EPA analysis is derived from nflfastR's public historical data. This dataset does not have classifications for formation or scheme, which means EPA based analysis typically doesn't have context for the degree of difficulty or intention of the play. Does a QB have high EPA because scheme put them in advantageous positions or because they really played at a high level?
A final (and perhaps least recognized) limitation of EPA is its susceptibility to leverage. The power of EPA comes from its ability to recognize that not all yards are created equal. Distance and field position matter. Averaging 5 yards per play generally isn't that great, but gaining 5 yards on any one play can be worth a whole lot of EPA if it converts a first down and extends a drive.
The problem with this approach is that it has a tendency to overweight individual plays that may or may not be very predictive of the future. For example, if a team loses a random fumble on first and goal, (which carries an EP value of about six points), they'll end the game with a heavily deflated EPA that understates their overall efficiency as an offense.
Closing
Perhaps the best way to think of EPA is as a means of attribution. It's a high level accounting tool that can provide deep insight with significant sample size, but that can also struggle when asked to do things like value individual players outside of the QB position.
EPA can tell us that teams should be passing more, especially in certain situations, but it can't tell us whether a coach's decision to pass or run was good based on the defense they faced on that particular play.
In the end, EPA is just one of the many new advanced metrics that are helping us improve our understanding of the game of football. It's been used to create better NFL game stats, evaluate teams, assess home field advantage, and even form better projections for fantasy football and player props. While EPA does have its limitations, there's no question its introduction has been a net positive for fans and the game of football alike.

@greerreNFL
NFL Analytics and Betting
Follow