:format(webp)/cdn.vox-cdn.com/uploads/chorus_image/image/25513793/20131201_sal_al2_189.0.jpg)
People look for that one stat that indicates if their team is playoff caliber. While Super Bowl winning head coach Brian Billick was the offensive coordinator of the Vikings, he came up with a formula called toxic differential.
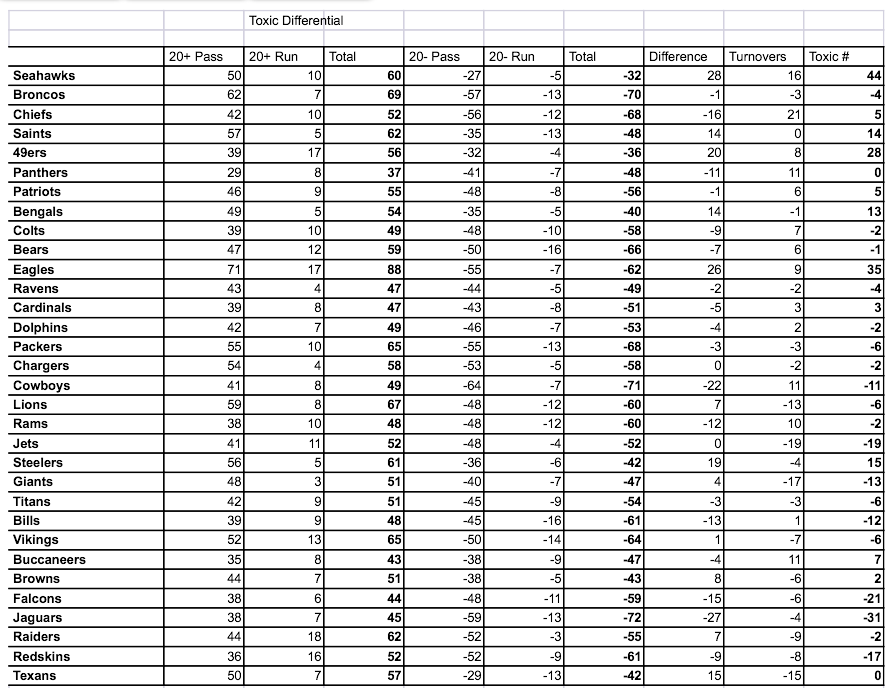
Toxic differential is the combination offensive 20+ yard plays and defensive 20+ yard plays. You hope the difference between those two is positive (meaning your offense has more 20+ yard plays than your defense is giving up) and then you put that against the turnover ratio for your result. Those are the basics of toxic differential.
*Sorted by best to worst record.
So as you look at it now. The Seahawks are the most dominate at +44 . The Eagles offense is actually more explosive than the Broncos at +88 vs +69.
And for your 2013 Chiefs:
+52 plays over 20 yards
-68 plays giving up 20 yards
+21 in turnover ratio
+5 Toxic Differential
In four AFC West games since the bye week, the Chiefs are -29 in plays their defense has given up. They were -19 during the three game losing streak and -10 against Oakland last week. Without those the plays given up would be at -39 instead of -68, which would bump their toxic from +5 to +34, nearly right up there with the Seahawks, Eagles and 49ers of the world. And that would likely mean a No. 1 seed because they could have won the two games at home.
Basically, the Chiefs defense has given up 16 more explosive plays than the offense can match.
Here are some other comparisons from over the years.
2010 Chiefs playoff team
+55 in plays over 20 yards
-54 in plays given up over 20 yards
+9 in turnover ratio
+10 in Toxic Differential
2003 Chiefs playoff team
 Read this
+66 in plays over 20 yards
-64 in plays given up over 20 yards
+19 in turnover ratio
+21 in Toxic Differential
2012 Ravens (Super Bowl champions)
+72 in plays over 20 yards
-57 in plays given up over 20 yards
+9 in turnover ratio
+24 in Toxic Differential
2012 49ers (NFC Champions)
+71 in plays over 20 yards
-47 in plays given up over 20 yards
+9 in turnover ratio
+33 in Toxic Differential
2004 Eagles (Andy Reid's Super Bowl appearance)
+67 in plays over 20 yards
-54 in plays given up over 20 yards
+6 in turnover ratio
+19 in Toxic Differential
2012 Chiefs (2-14 season)
+49 in plays over 20 yards
-70 in plays given up over 20 yards
-24 in turnover ratio
-45 in Toxic Differential
The thing that's fun about toxic differential is the accuracy. Some of the top rushing or passing offenses don't make it to the post-season. They turn the ball over to much (2012 Chiefs) or their defense struggles. This is a great barometer of how teams stack up on a weekly basis.
By the way, you should look at the Texans against the Broncos. It shows Sunday may get interesting in their head to head numbers.
Until next time, keep crunching.